Cycle Lanes Erode Bus Efficiency Across Global Cities
TfL data links dedicated cycle lanes to slower bus speeds and lower demand, with capacity mismatches and priority signal limits compounding delays in London and 15 other cities.
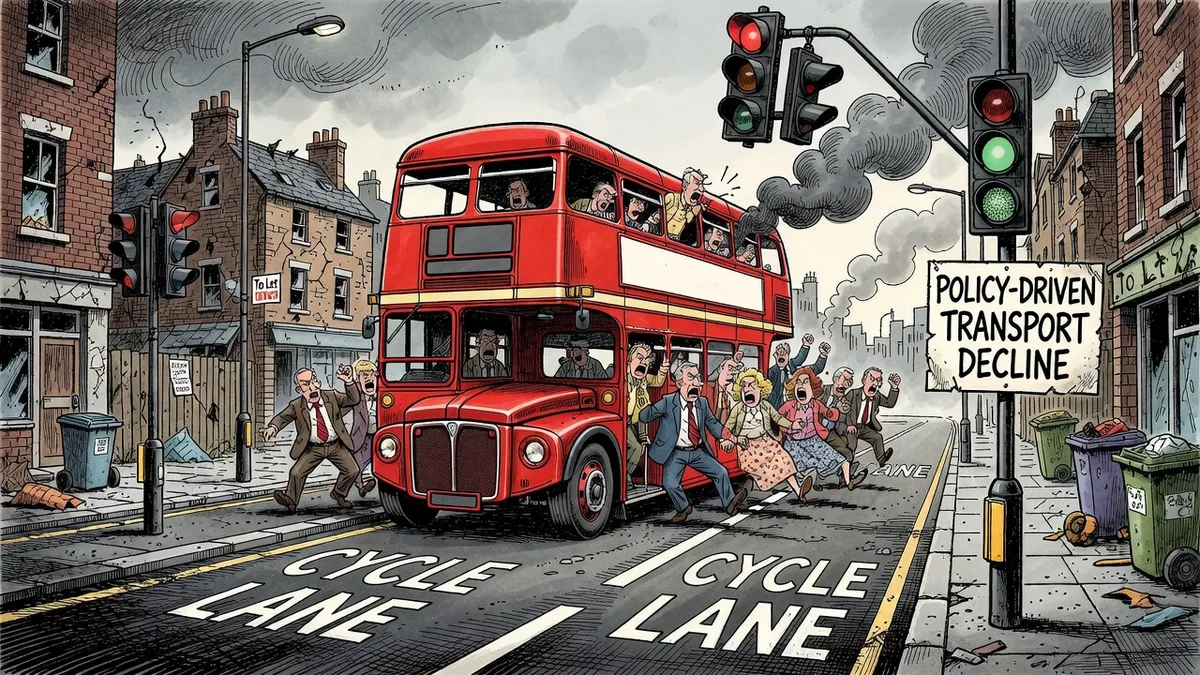
London Buses Lose Ground to Underused Cycle Lanes
Bus speeds in London continue to fall as dedicated lanes shift from mass transit to individual cycling infrastructure. TfL data shows a 10 percent drop in average bus speed cuts passenger demand by 6 percent. Similar patterns appear across 15 other global cities tracked by Imperial College London.
Cycle lanes now occupy road space previously available for buses on many routes. These lanes sit largely empty outside weekday peaks between 7.30am and 9am or 4pm and 5pm. The result is slower journey times and reduced reliability for the higher-volume service that carries most commuters.
Priority Signals Fail at Scale
Traffic signal priority for buses cannot scale on routes running every two minutes. Each junction receives 30 priority requests per hour in each direction, leaving no recovery time between interventions. Bristol engineers reached the same conclusion after reviewing their own bus priority measures in congested zones.
Retiming lights offers no lasting fix once traffic density exceeds a threshold. The physical constraint remains the number of vehicles required to move the same passenger volume.
Capacity Mismatch Locks in Delays
One tram carries the passenger load of three or four buses while occupying less road space per person. French cities that installed trams since the 1980s rebuilt central areas around higher-capacity routes and recorded visibly higher footfall. Sheffield demonstrates that trams can share space with other traffic and maintain consistent timetables through peak and off-peak hours.
UK policy instead favours visible cycle infrastructure that delivers lower throughput. This choice reduces the effective catchment area for jobs, customers and retail without measurable gains in overall mobility.
Economic Drag Compounds Over Time
Slower cross-city movement shrinks labour markets and high street access. Firms recruit from narrower pools. Workers reach fewer opportunities. Retail footfall declines as the friction of travel rises.
These effects accumulate regardless of which party holds office. Each administration inherits the same road network constraints and the same incentive to deliver visible projects ahead of measurable throughput improvements.
The pattern shows transport policy measured by column inches rather than passenger kilometres delivered. Cities pay the cost in reduced economic reach and persistent service deterioration.
Commentary based on How poor public transport policy is putting the brake on cities by Guardian Staff on the Guardian.
← Back to commentary